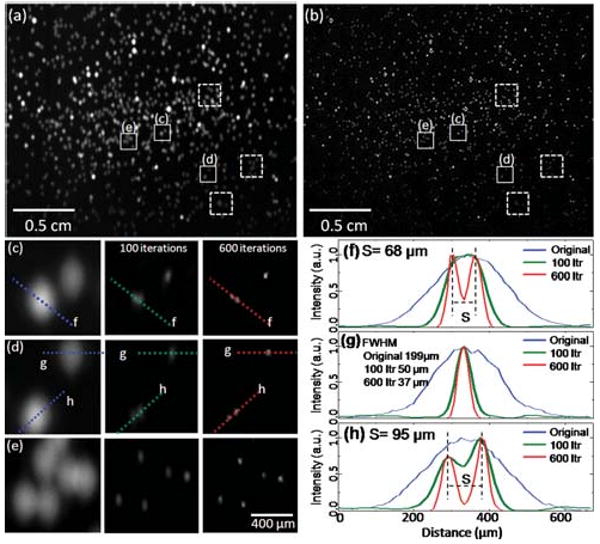
Fig. 2.

(a) Lens-free fluorescent imaging is illustrated over a FOV of >8 cm2 for 10μm fluorescent beads (excitation/emission: 495 nm/505 nm). The raw lens-free image (a) was pumped through an LED (see Fig. 1) and was acquired with an integration time of 1 s, (b) illustrates the digitally deconvolved fluorescent image of the same FOV. The zoomed images (c–e) are cropped from the raw fluorescent image (a), and next to each zoomed image, the result of the deconvolution process is illustrated as a function of the number of iterations (100 vs. 600). In (c) and (d), the letters and the dashed lines within the frames refer to (f) and (h), which illustrate different cross-sections of the raw and the deconvolved fluorescent images, demonstrating ∼5× improvement in fluorescent spot size. Through the iterative deconvolution process two particles that almost completely overlap at the raw lens-free image, see for instance (c–d), can now be separated from each other as shown to the right of (c–d) and in (f, h). Note that the pixel size of the CCD in this experiment is 9 μm, and the resolution of the deconvolved lens-free fluorescent image could be further improved with a smaller pixel.
