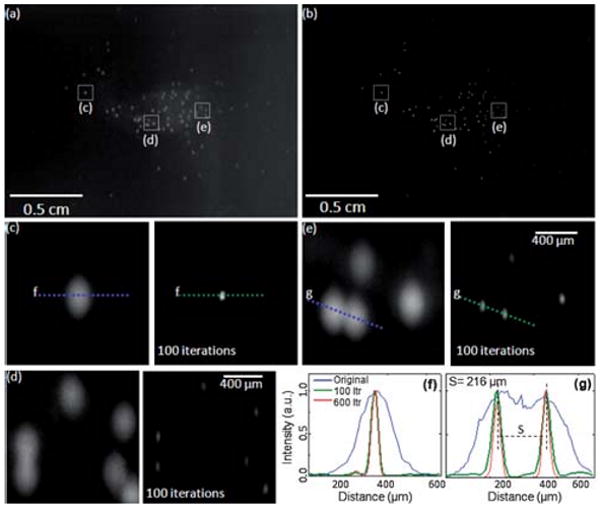
Fig. 3.

Lens-free fluorescent imaging (a) and the results of the iterative deconvolution algorithm (b) are demonstrated for Calcein Labeled WBCs. The zoomed images at the bottom are cropped from (a) and (b) to illustrate the success of the deconvolution. (f) and (g) illustrate the cross-sections of fluorescent signatures for the raw lens-free image (blue curve) as well as for 100 (green curve) and 600 (red curve) iterations of deconvolution. The FWHM of the deconvolved fluorescent signature in (f) improved by ∼5× from 191μm to 38μm. (g) illustrates a similar situation for two overlapping fluorescent signatures.
