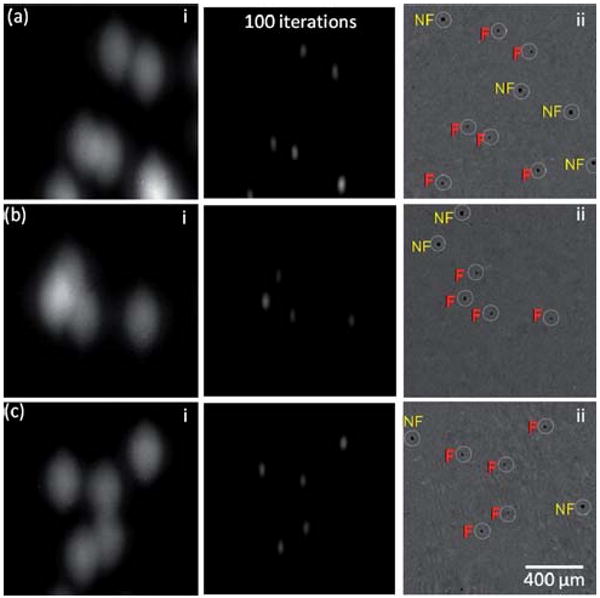
Fig. 4.

Lens-free holography14 and on-chip fluorescent imaging is demonstrated within regions shown with the dashed squares of Fig. 2(a–b). In (a–c) left column, the raw lens-free fluorescent images are shown. To the right of these images, the results of digital deconvolution are presented. In (ii) on the far right, lens-free holographic imaging results of the same field of view are presented, which show the shadow signatures of all the particles, both fluorescent (F) and non-fluorescent (NF), whereas the other images on the left only show the fluorescent signatures.
