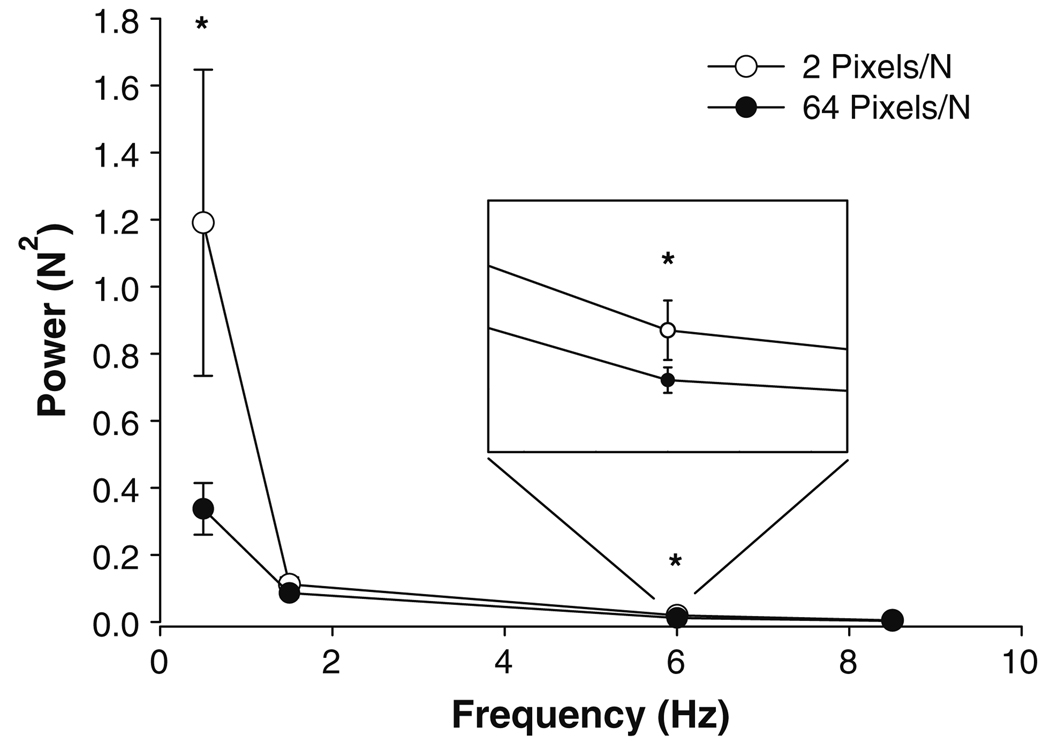
Fig. 4.
Power spectrum of the force output. The force spectrum was analyzed from 0–1, 1–3, 3–7, and 7–10 Hz bins. The x-axis is presented as the mean frequency of each band (0.5, 2, 5, and 8.5 Hz). Although the overall shape of the power spectrum was similar for 2 pixels/N (open circles) and 64 pixels/N (filled circles), there was a significant difference between the visual gains at 0–1 and 3–7 Hz (asterisk). Specifically, the higher visual gain (64 pixels/N) decreased power from 0–1 and 3–7 Hz (inset) compared with the lower visual gain (2 pixels/N)

