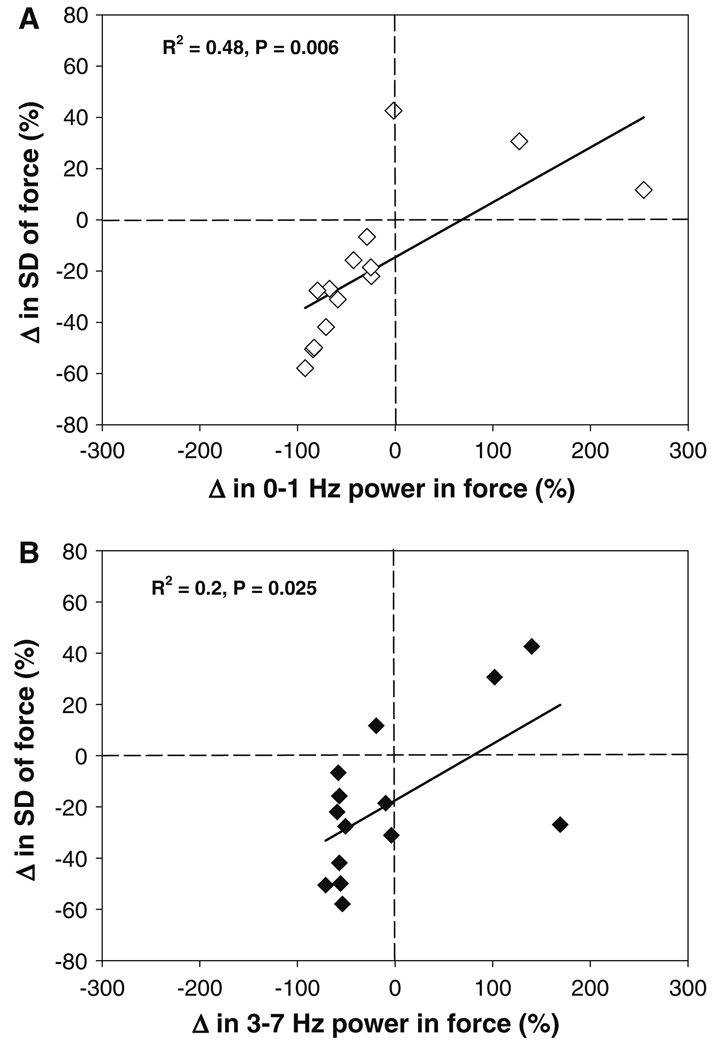
Fig. 5.
Prediction of the change in SD of force. The decrease in SD of force with greater visual gain was associated with a decrease in power from 0–1 and 3–7 Hz. a The change of power from 0–1 Hz in the force power spectrum predicted the change in the SD of force. The relation indicates that modulation of force at 0–1 Hz accounted for ~48% of the decrease in the variability of force (R2 = 0.48, P = 0.006). b The change of power from 3–7 Hz in the force power spectrum predicted the change in the SD of force. The relation indicates that modulation of force at 3–7 Hz accounted for ~20% of the decrease in the variability of force (R2 = 0.2, P = 0.025)

