
Fig. 2.
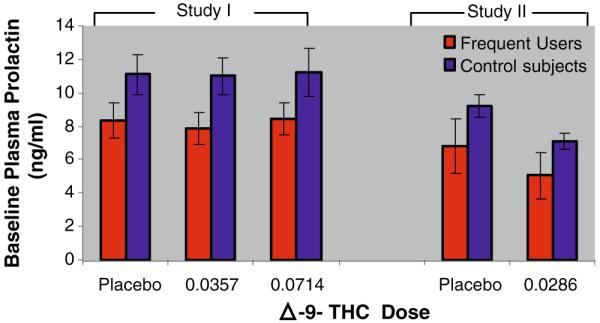
Baseline plasma prolactin. The X-axis denotes Δ-9-THC dose and the Y-axis denotes the baseline plasma prolactin levels mean (±SEM). Compared to healthy controls, frequent users had lower baseline plasma prolactin levels (p=0.007)
Official websites use .gov
A
.gov website belongs to an official
government organization in the United States.
Secure .gov websites use HTTPS
A lock (
) or https:// means you've safely
connected to the .gov website. Share sensitive
information only on official, secure websites.
Baseline plasma prolactin. The X-axis denotes Δ-9-THC dose and the Y-axis denotes the baseline plasma prolactin levels mean (±SEM). Compared to healthy controls, frequent users had lower baseline plasma prolactin levels (p=0.007)