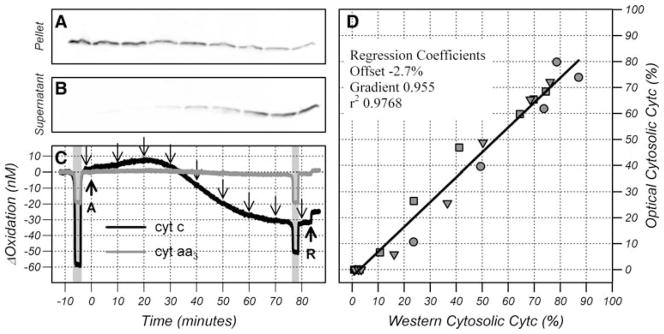
Fig. 4.
Comparison of mitochondrial fraction (a) and cytosolic fraction (b) of cyt c measured by Western analysis with the time course of cyt c and cyt aa3 oxidation changes (c). Cells were treated with anisomycin (arrow A) and rotenone (arrow R) and an anoxia (shaded area) was performed before and 78 min after anisomycin treatment. Samples for western analysis were taken at the time points indicated by the downward arrows. Comparison of cytosolic fraction of cyt c calculated from the reduction post anisomycin to the cytosolic fraction of cyt c quantified from the Western data (d). Data points (symbols) are from three independent experiments and the line is a linear regression through all the data points

