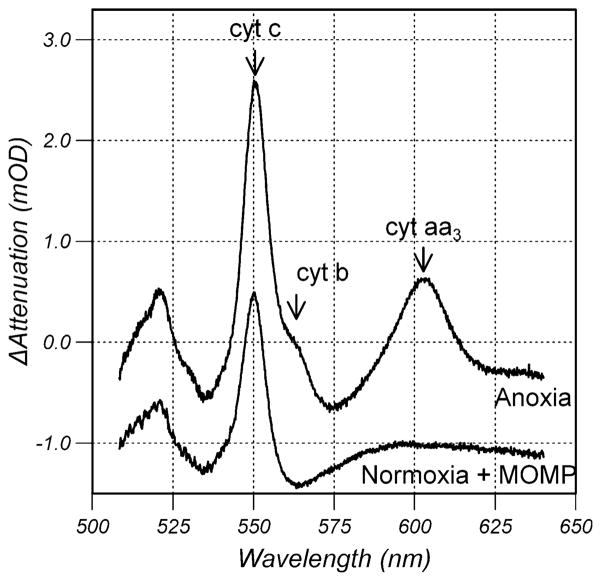
Fig. 5.
Change in attenuation spectra obtained during anoxia prior to anisomycin treatment and at saturating oxygen tension 90 min after anisomycin treatment when release of cyt c was complete. The anisomycin treated spectrum has been offset by −1mOD for clarity. The labels cyt c, cyt b and cyt aa3 identify the absorption bands originating from cyt c, the b-cytochromes of the bc1 complex and cyt aa3, respectively

