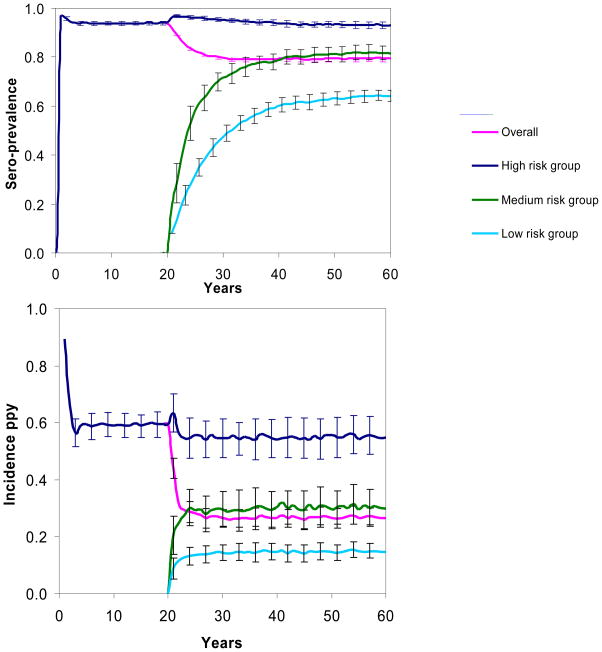
Figure 2.
HCV sero-prevalence and incidence of acute infection for Phases 1 and 2, overall and by risk group. Behavior change is modeled to begin 20 years after the start of the epidemic. Lines show the average over 100 realizations of the model, and error bars delineate one standard deviation in either direction.

