Fig 6.
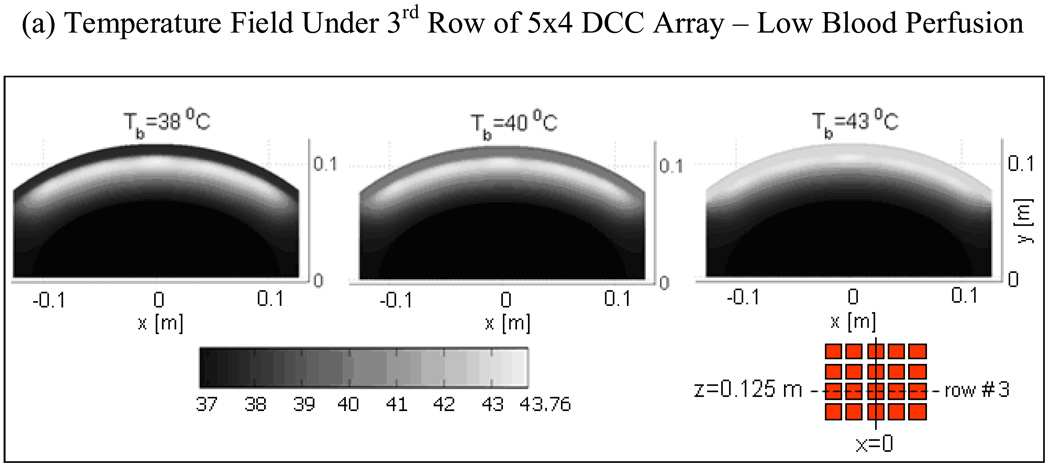
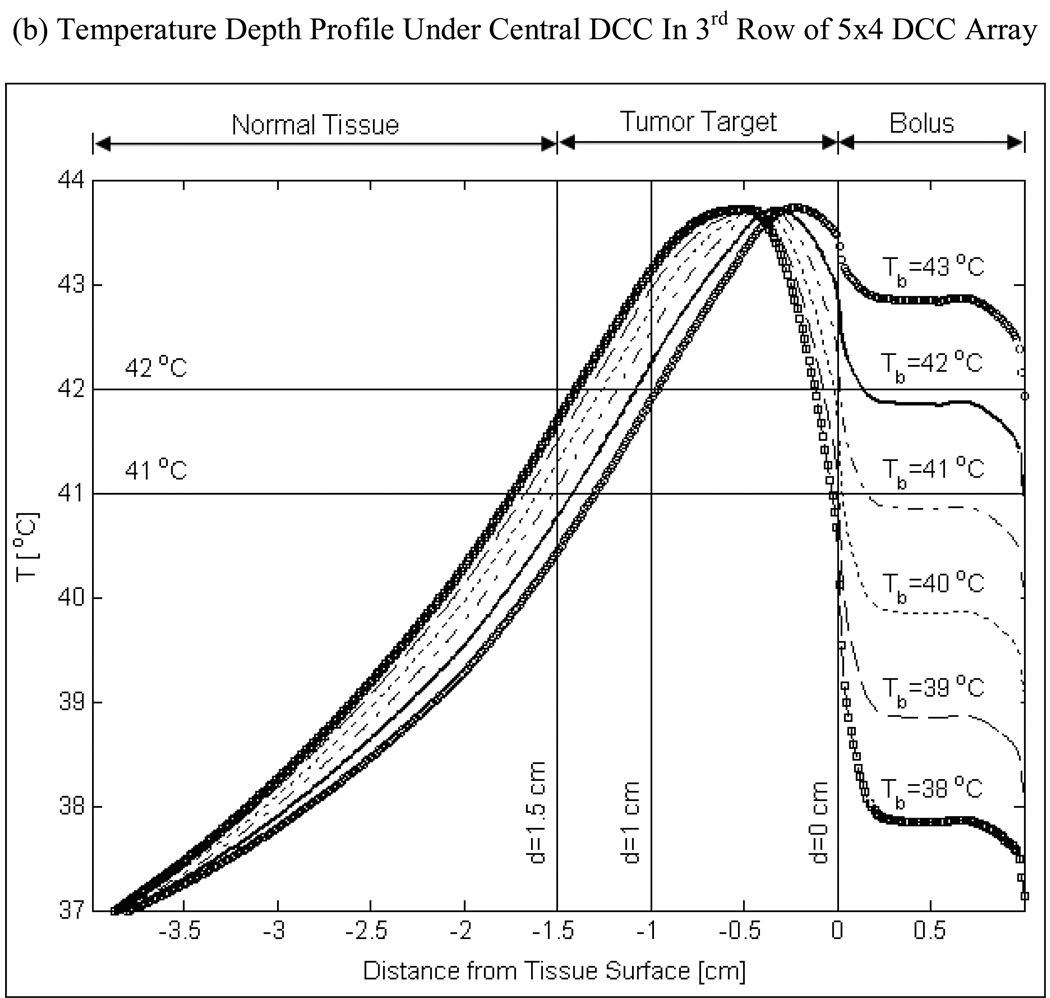
Steady state temperature distributions produced by 5×4 DCC CMA of R-TBSA for varying bolus temperature and moderately perfused tumor target (ωb=2 kg/m3/s) at 4 L/min bolus flow rate. (a) 2D temperature fields beneath the 3rd row of 5×4 DCC CMA at z=0.125m; (b) Temperature depth profiles at x=0 and z=0.125 m indicating the impact of bolus temperature on tissue heating.


