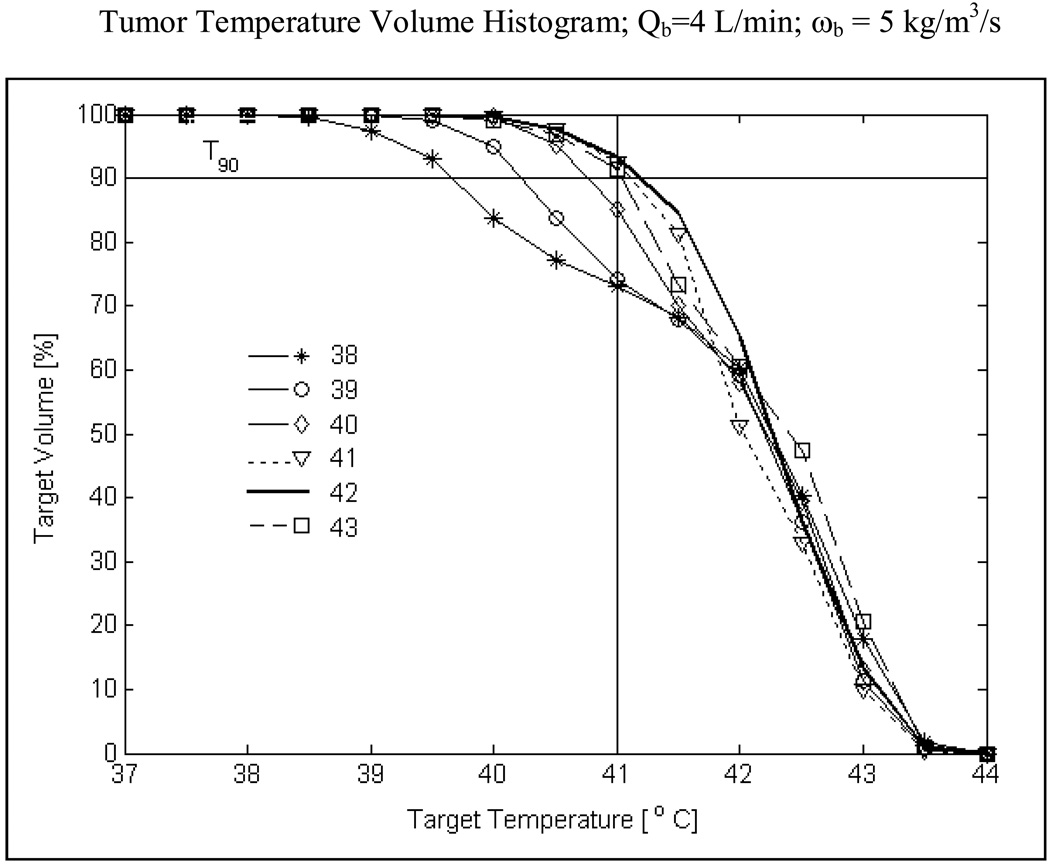
Fig 9.
Temperature volume histogram inside tumor target extending 10 mm from surface (including surface) with severe blood perfusion calculated for varying bolus inlet temperature. T90 value i.e., temperature that 90% of the target volume is above in Fig 9 for the worst case scenario (ωb=5 kg/m3/s) anticipated during hyperthermia indicates a maximum for 42°C water bolus and decreasing values for lower and higher bolus temperatures.

