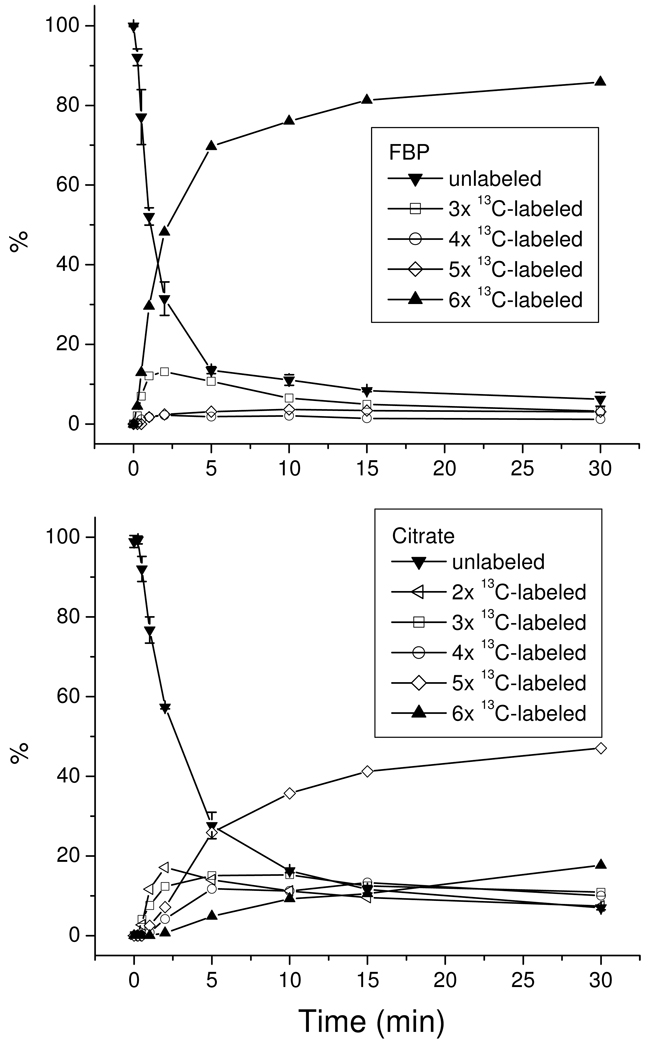
Figure 3.
Relative labeling percentage of two representative metabolites as a function of time: fructose-1,6-bisphosphate (FBP, top panel), and citrate (bottom panel). For the purpose of simplicity, the following labeled forms were not plotted: 13C1- and 13C2-labeld FBP which has a maximum percentage of 1.7% and 1.4%, respectively, and 13C1-labeled citrate which has a maximum percentage of 1.3%. The standard deviations for N=2 were plotted only for the unlabeled forms.

