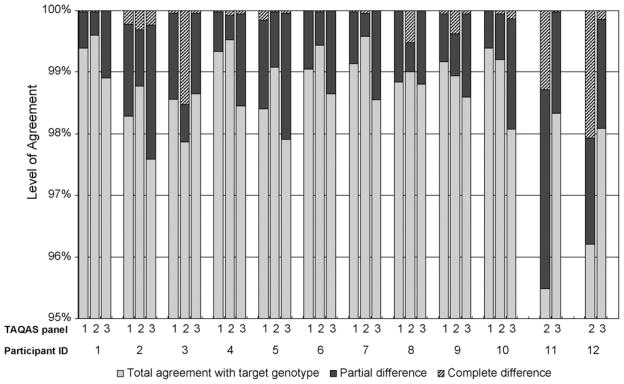
Fig. 1.
Level of agreement between the participants’ entire edited nucleotide sequences and the target genotype (TG) in up to three TAQAS. Most participants reported >98% agreement with the TG (grey bars) (10 of 10 participants that tested TAQAS 1,9 of 12 participants that tested TAQAS 2, and 10 of 12 participants that tested TAQAS 3). Most of the differences reported from the TG were partial differences (black bars). Less than 0.5% of the differences reported from the TG were complete differences (hatched bars) for the majority of participants (all participants that tested TAQAS 1 and 3, and 8 of 12 participants that tested TAQAS 2).

