
Figure 2.
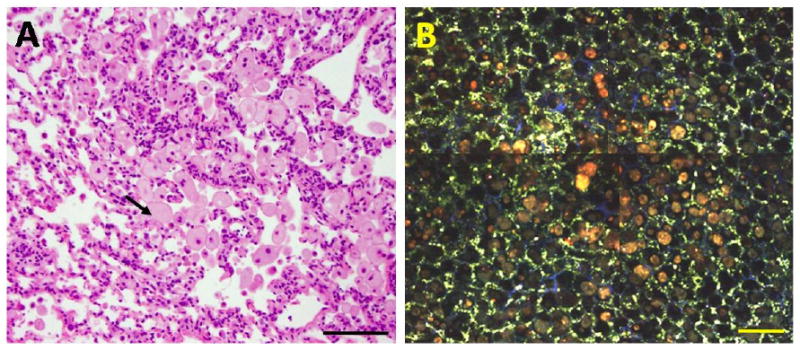
MPM imaging of lipid pneumonia in murine lungs. The sample was collected from a 14 month old Rrm2Tg mouse with a small white mass visible on the lung surface at necropsy. After imaging, the sample was fixed in 10% buffered formalin, and then embedded, sectioned, and stained with H&E (A). A series of MPM images was collected and assembled into a mosaic composite (B). The MPM and H&E images are from similar but not identical regions of the sample. Two-photon fluorescence and SHG were excited at 780 nm and detected at 355-425 nm, 440-500nm and 505-655 nm emission bands. In the displayed superimposed images blue color indicates emission at 355-425 nm; green color represents fluorescence at 440-500 nm; and red color indicates fluorescence at 505-655 nm. The black arrow in (A) points to a lipid-filled macrophage, characteristic of lipid pneumonia in mice. Scale bar: 100um.