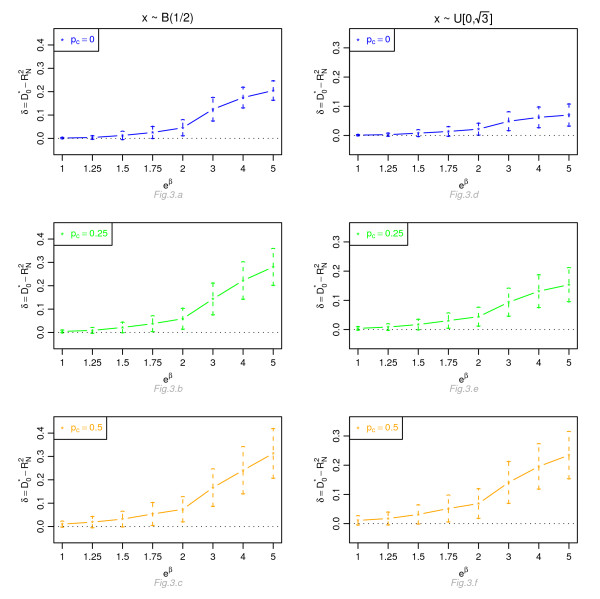
Figure 3.
Graphic of the differences δ between the mean values of  and the mean values of
  as a function of the hazard ratio, for a Cox proportional hazards model. Mean of
  as a function of the relative risk eβ, for different percentages of censoring pc, for a covariate with Bernoulli ℬ(1/2) or uniform
  [0,
[0,  ] distribution, n = 100 and a uniform censoring mechanism.

