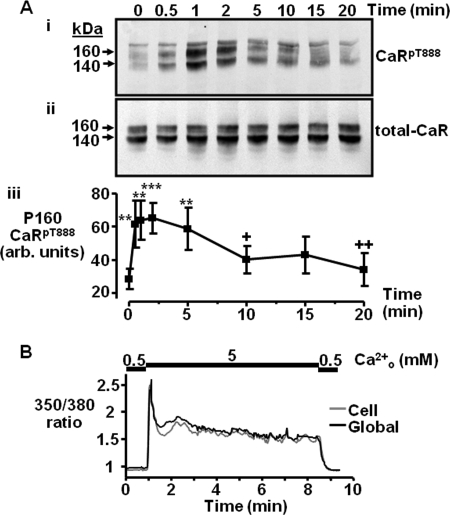
FIGURE 4.
Impacts of a maximally effective Ca2+o concentration on time-dependent CaRT888 phosphorylation and Ca2+i mobilization. A, representative Western blot showing CaRpT888 (i) and total CaR (ii) immunoreactivity following exposure to 5 mm Ca2+o for different lengths of time up to 20 min. Quantification of the changes in CaRT888 phosphorylation expressed in arbitrary (arb.) units for the 160-kDa CaR band is shown in panel iii (n = 5). **, p < 0.01, ***, p < 0.001 versus t0; +, p < 0.05, ++, p < 0.01 versus 1-min treatment by repeated measures ANOVA (Tukey post test). B, representative trace showing Ca2+i changes in a single cell (gray) or global cluster of cells (black) in response to 5 mm Ca2+o (n = 3).

