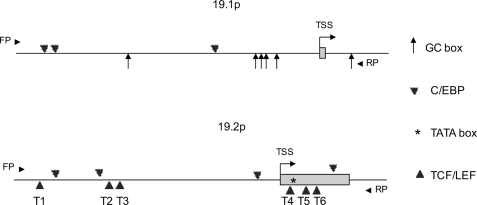
FIGURE 2.
Schematic representation of TNFRSF19 promoters for both transcripts. Promoter sequences were retrieved from the Transcriptional Regulatory Element Data base and analyzed by TFsitescan and TFSEARCH. FP and RP represent forward primer and reverse primer employed for promoter cloning. TSS represents the transcription start site defined by RefSeq and the first exon was indicated as box. The promoter of TNFRSF19 transcript 1 (19.1p) contains six GC box and three C/EBP binding sites within the −1149 to +178 bp region (upper). The promoter of TNFRSF19 transcript 2 (19.2p) contains a TATA box in the first exon, six canonical TCF/LEF binding sites (CTTTGWW, T1 to T6), and four C/EBP binding sites within the −975 to 342 bp region (bottom).

