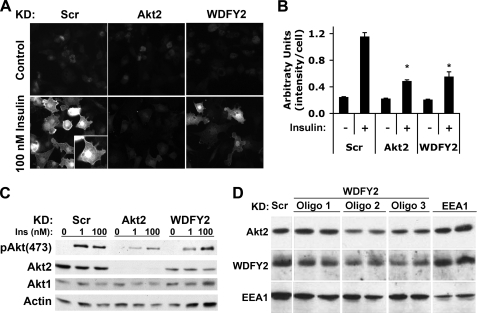
FIGURE 2.
Effect of WDFY2 depletion on Akt phosphorylation. A, 3T3-L1 adipocytes transfected with Scr, WDFY2, or Akt2 siRNA 48 h prior to the experiment were serum-starved and insulin-stimulated for 15 min (100 nm). The cells were briefly washed and fixed in 4% formaldehyde (15 min) and 95% methanol (5 min) prior to immunofluorescence analysis of pAkt(473). B, average intensity of immunofluorescence staining in control and insulin-stimulated cells from A is shown. 20 frames representing a total of ∼375 cells per group were analyzed and are presented as mean intensity/cell ± S.E. (error bars), p < 0.01, Student's t test. C, 3T3-L1 adipocytes transfected with Scr, WDFY2, or Akt2 siRNA 48 h prior to the experiment were serum-starved and insulin (Ins)-stimulated for 15 min (1 or 100 nm). Lysates were subjected to SDS-PAGE and immunoblotting using pAkt(473), Akt2, Akt1, and actin antibodies. D, 3T3-L1 adipocytes were transfected with Scr, WDFY2, or EEA1 siRNA 48 h prior to lysis. Three different WDFY2 oligonucleotides (Oligos) 1–3 were used. Lysates were subjected to SDS-PAGE and immunoblotting using antibodies to Akt2, WDFY2, and EEA1.

