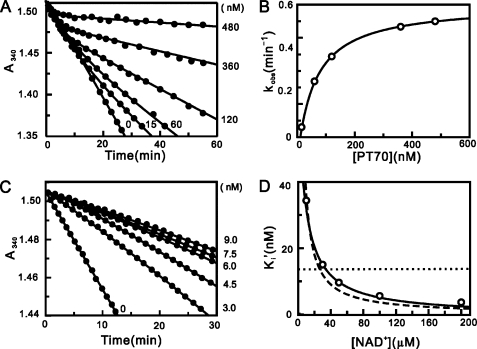
FIGURE 2.
Progress curve analysis for the inhibition of InhA by PT70 and effect of NAD+ on the apparent inhibition constant of PT70. A, progress curves were obtained for inhibitor concentrations ranging from 0 to 480 nm. The solid curves are the best fits of the data to Equation 2. B, kobs plotted as a hyperbolic function of [PT70] using Equation 3. C, progress curves of InhA activity recovery were obtained for inhibitor concentrations ranging from 0 to 9 nm. The solid curves are the best fits of the data to Equation 2 to obtain kobs, which was then plotted against [PT70] using Equation 3 to obtain k−2. D, effect of NAD+ on the apparent inhibition constant of PT70. The fitted curves are shown for Equation 6 (dashed line; K1 = 0.0146 ± 0.0009 nm), Equation 7 (dotted line; K2 = 13.6 ± 5.5 nm), and Equation 8 (solid line; K1 = 0.022 ± 0.001 nm, K2 = 90.6 ± 9.7 nm).

