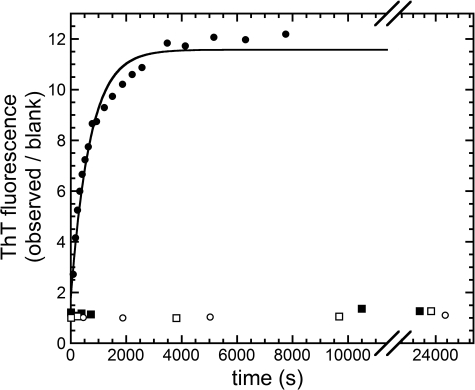
FIGURE 1.
Aggregation time courses, monitored using ThT fluorescence, of four samples containing 0.4 mg ml−1 Sso AcP and different experimental conditions. The conditions were: 50 mm NaCl, 50 mm acetate buffer, 20% (v/v) TFE, pH 5.7 (●); 50 mm NaCl, 50 mm acetate buffer, pH 5.7 (○); 50 mm NaCl, 50 mm phosphate buffer, 20% (v/v) TFE, pH 5.7 (■); and 50 mm NaCl, 50 mm phosphate buffer, pH 5.7 (□). The continuous line represents the best fit to Equation 1 (see “Materials and Methods”) of the data collected in acetate buffer with TFE.

