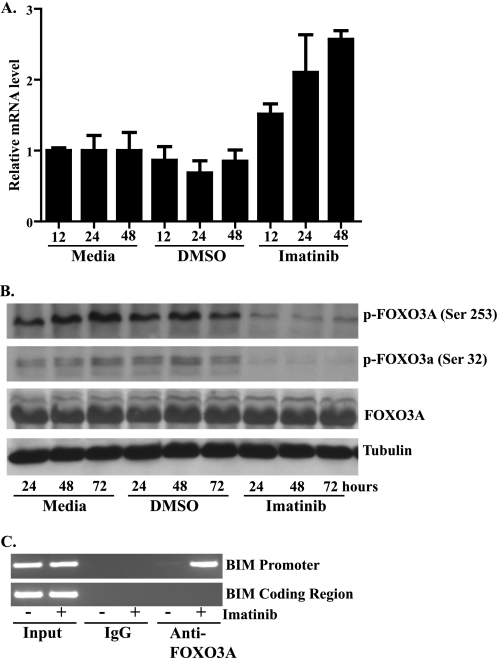
FIGURE 4.
Transcriptional regulation of BIM by FOXO3a contributes to BIM up-regulation following imatinib treatment in GIST 882. A, quantitative reverse transcription-PCR analysis of total RNA isolated from GIST 882 cells following treatment with medium, DMSO, or 1 μm imatinib. BIM mRNA levels were normalized to β-actin. Reactions were performed in triplicate, and data represent mean (±S.D.) of three experiments. B, Western blot analysis of whole-cell lysates prepared from GIST 882 cells following treatment with medium, DMSO, or 1 μm imatinib. Blots were probed with antibodies specific to FOXO3a, phospho-FOXO3a (Ser253), phospho-FOXO 3a (Ser32), or tubulin (loading control). C, chromatin immunoprecipitation assay of GIST 882 cells after 1 μm imatinib treatment for 48 h. Chromatin fragments were immunoprecipitated with antibodies to FOXO3a or IgG (nonspecific control), and DNA was amplified by PCR with primers specific to either the BIM promoter or BIM coding region, to control for chromatin size.

