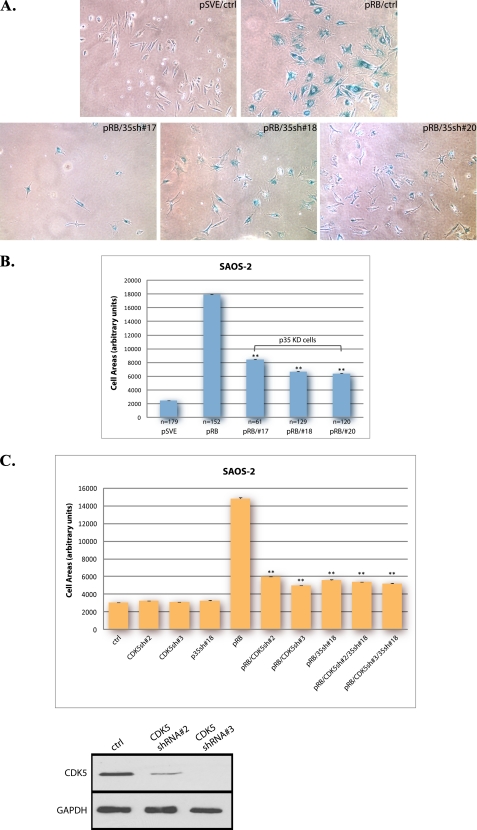
FIGURE 3.
Knockdown of p35 reduces pRB-induced flat cell formation in SAOS-2 cells. A, SAOS-2 cells were cotransfected with pSVE-Rb and pLKO-p35shRNA-17, -18, -20, or control empty vector, cells transfected with empty vectors were use as control. 16 h after transfection, cells were selected with puromycin at a final concentration of 0.5 μg/ml. 10 days post-transfection, cells were assayed for SA-β-gal expression, and the morphology change in these cells is shown. All images were obtained by using phase contrast microscopy at a magnification of ×10. B, cell area in pRB-induced senescent SAOS-2 cells was measured using ImageJ. Means and S.E. of data collected in each group are presented in the column chart. To compare the difference in size between pRB-transfectant cells and p35-knockdown cells, p values were determined using both unpaired two-tailed Student's t test and one-way ANOVA. A p value < 0.001 is indicated by **. The experiment was repeated three times. C, pSVE or pSVE-Rb was transfected into SAOS-2 cells with MKO-CDK5 shRNA2, -3, and/or pLKO-p35shRNA-18. Cell area in each group was measured using ImageJ. Means and S.E. of three experiments are presented in the column chart. A p value < 0.001 versus pRB control is indicated by **. Bottom panels, the efficacy of shRNAs for CDK5 was tested by transfecting MKO-CDK5shRNA-2, -3, or control empty vector into SAOS-2 cells. Cell lysates were collected 2 days after transfection and were immunoblotted for CDK5.

