FIGURE 6.
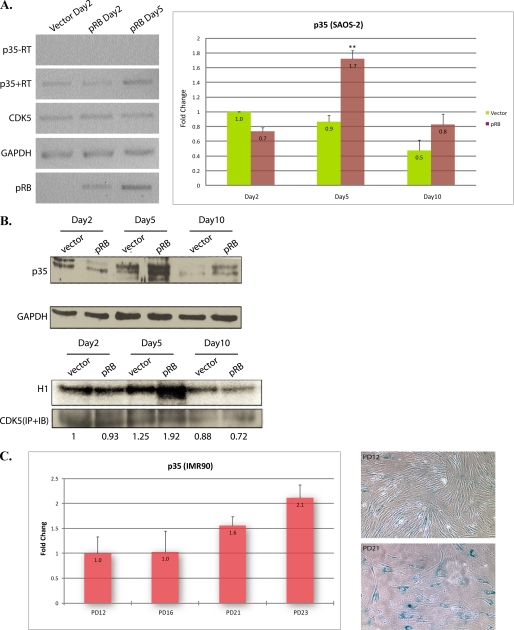
p35 is increased in senescing SAOS-2 and IMR90 cells. A, SAOS-2 cells were infected with pRB or control GFP lentiviruses. 16 h after infection, cells were selected with puromycin at a final concentration of 0.5 μg/ml. p35 mRNA levels at 2, 5, and 10 days post-transfection were examined by semi-quantitative RT-PCR (left), -RT, negative control using RNA samples not subjected to reverse transcription, or quantitative real-time PCR in triplicate (right), error bars show S.D. **, p < 0.001 versus day 2 empty vector control. B, cell lysates were prepared from cells infected with pRB or control GFP lentiviruses, followed by MG132 (20 μm) treatment for 16 h before harvest. Immunoblotting was performed using anti-p35 antibody (upper panels), and immunoprecipitation with anti-Cdk5 antibody was performed followed by an in vitro kinase assay using histone H1 as the substrate (lower panels). Numbers at the bottom of panels show ratio of kinase activity in each lysate to control lysate of day2. C, real-time PCR (in triplicate) for p35 (left) was performed with total mRNA prepared from early and middle passage IMR90 cells, error bars show S.D. SA-β-gal assay (right) was performed on IMR90 cells at early and middle passage.

