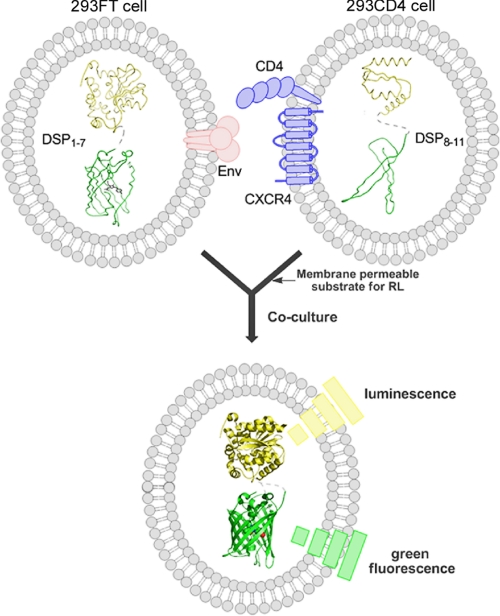
FIGURE 2.
Schema of the cell-based membrane fusion assay with DSPs. The 293FT cells, expressing HIV-1 Env and DSP1–7, and 293CD4 cells that harbor receptors (CD4 and CXCR4) and DSP8–11 were co-cultured to induce membrane fusion. The degree of membrane fusion was monitored in a time-dependent manner using RL and GFP activities. The DSP1–7 and DSP8–11 are schematically shown with structures of the RL (yellow, based on PDB code 2pse) and superfolder GFP (green, based on PDB code 2b3p) represented in a ribbon diagram.

