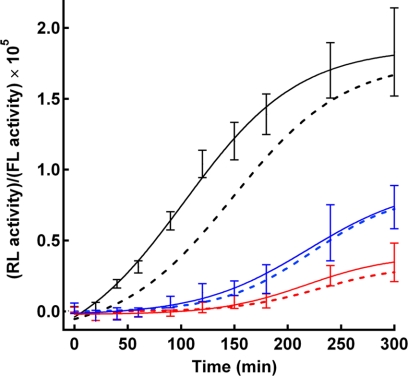
FIGURE 5.
Analysis of membrane fusion by temperature shift. After the induction of TAS at 25 °C, the incubation temperature of the co-culture was shifted to 37 °C. The progress of membrane fusion was followed by the RL activity of the DSP system as described under “Experimental procedures.” The black, blue, and red lines are used to indicate the results of WT, GpA, and VSV-G mutants, respectively. The results in the presence (solid lines) or absence (broken lines) of the induction of TAS are shown. FL, firefly luciferase.

