FIGURE 7.
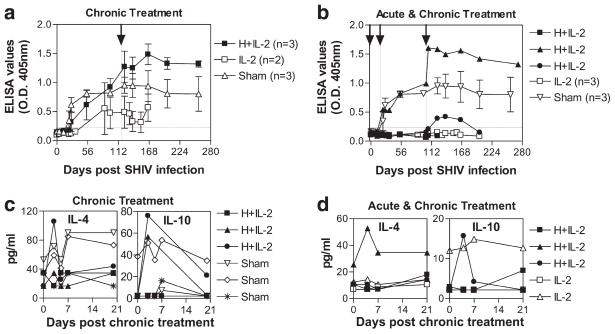
Virus-specific Abs and Th2 cytokines increase after massive Vγ2Vδ2 T cell expansion during chronic infection. Env-specific IgG levels in 1/50 diluted plasma were analyzed by ELISA and read at OD405 nm are shown over time as averages for each group (a and b) except for HMBPP plus IL-2 treated animals in (b) where individual animals are shown. Arrows and vertical lines indicate the time when treatment was given, while horizontal lines indicate cutoff OD value (<0.23) (a and b). Data shown are averages of three independent ELISA assays. Compared with pretreatment baseline levels, Ab titers increased more after cotreatment than they did after sham treatment (p < 0.05). Also, at days 166–258 postinfection, Ab levels remained significantly higher in the cotreated group compared with sham-treated group (p < 0.05, by Student’s t test). Plasma IL-4 and IL-10 concentrations are shown upon treatment during chronic infection (c and d). Groups treated with HMBPP plus IL-2, IL-2 alone, or sham only during chronic infection (a and c) or during both acute and chronic infection (b and d) are shown. The increases in IL-4 (p = 0.049) and IL-10 (p = 0.0109) at day 3 post-HMBPP plus IL-2 treatment are statistically different from pretreatment (c and d).

