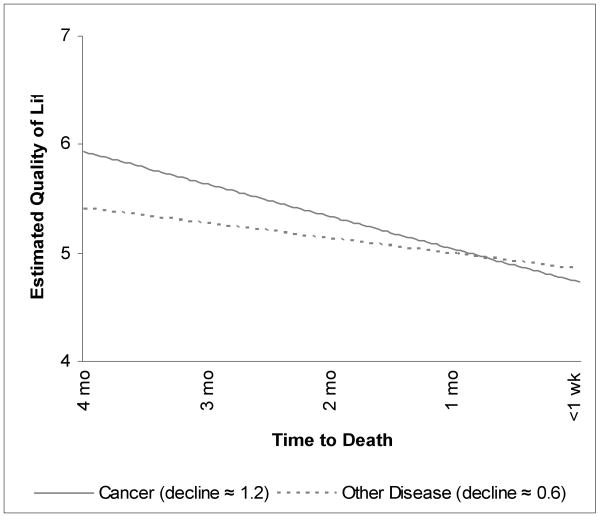
Figure 2. Estimated Quality of Life Trajectories*.
* Trajectories were estimated with multilevel modeling, using responses of 127 respondents over time, in a model including diagnosis and time from enrollment to death as predictors of the slope. The estimated trajectories depicted in the graph are for patients who enrolled in the study 123 days before death (the median for patients with cancer). Quality of life ratings could range from 0 (no quality of life) through 10 (perfect quality of life).

