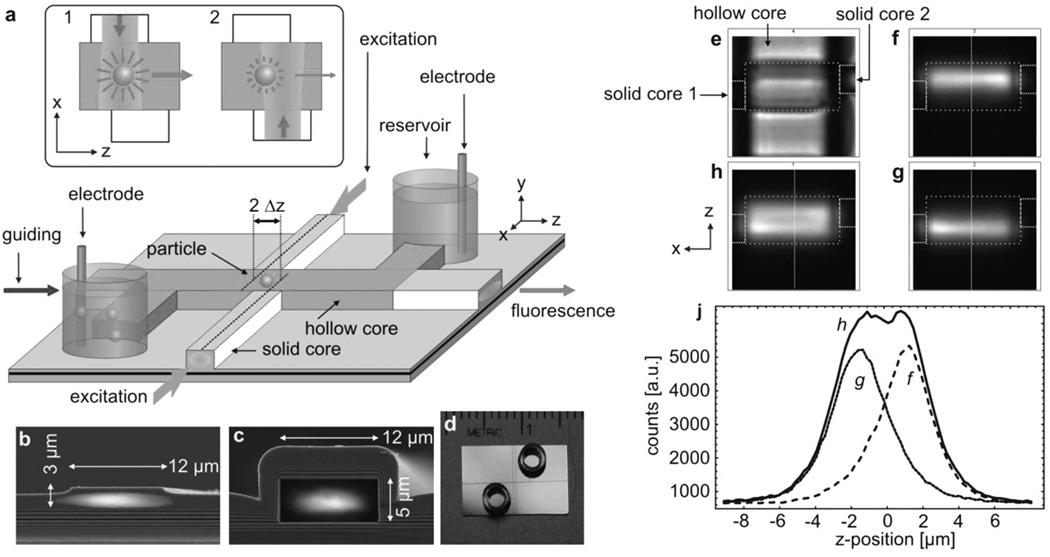
Fig. 1.
(a) Schematic layout of the ARROW optofluidic analysis platform. Inset: Working principle of the particle position sensor showing the illumination during 1) the first and 2) the second half-period of modulation. (b) Solid-core waveguide with overlayed optical mode profile. (c) Same for hollow-core waveguide. (d) Photograph of the actual chip with reservoirs. (e) Bright-field top view of the intersection region with boundary outline. (f–h) Fluorescence micrographs of the excitation beams with the right, left and both beams activated. (j) Cross-section as indicated in f–h.

