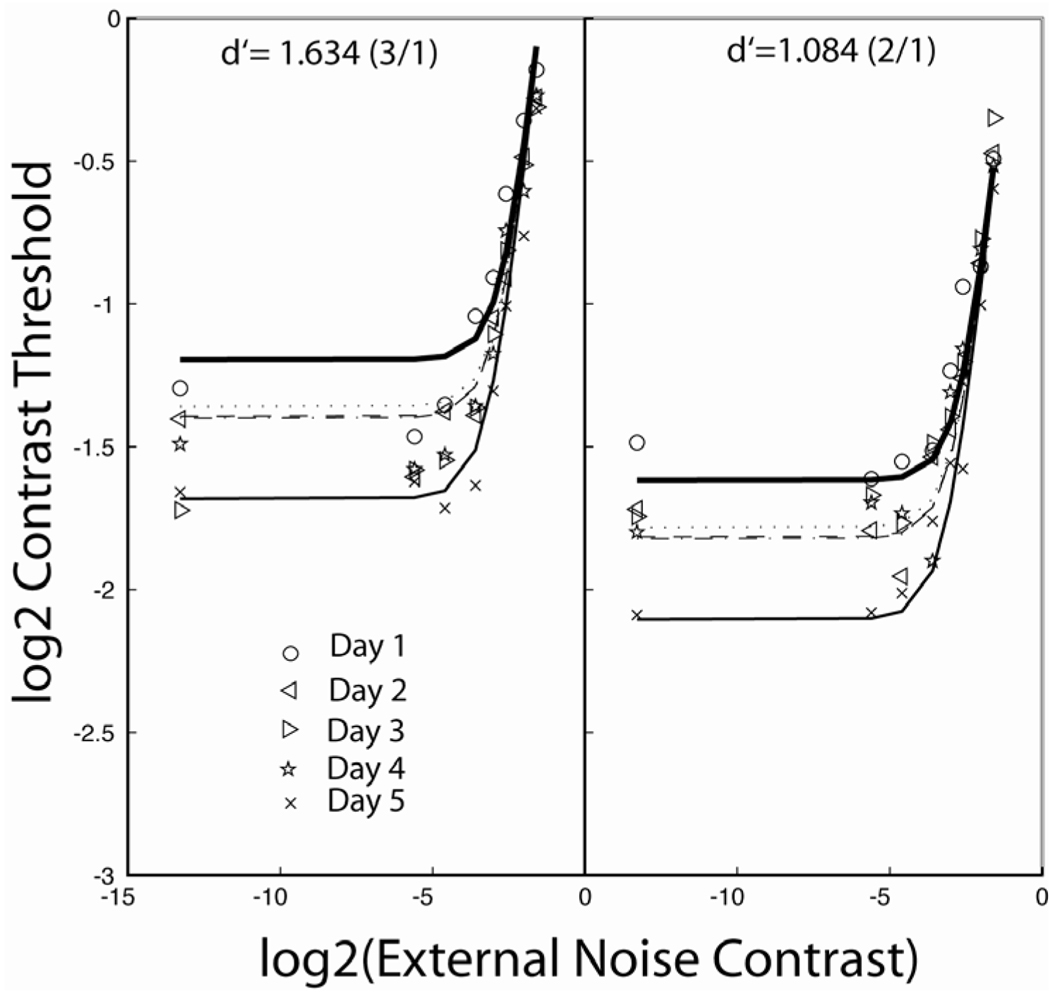
Figure 6.
Contrast thresholds, averaged over observers, as a function of external noise contrast (TvC functions) for five practice days in the texture (2nd-order) letter task (Dosher and Lu, 2006). Data are shown for two criteria (3/1 and 2/1 staircases). The dark heavy lines are Day 1, and the lighter heavy lines are Day 5. Smooth curves are the fit of a PTM model with perceptual learning through stimulus enhancement.

