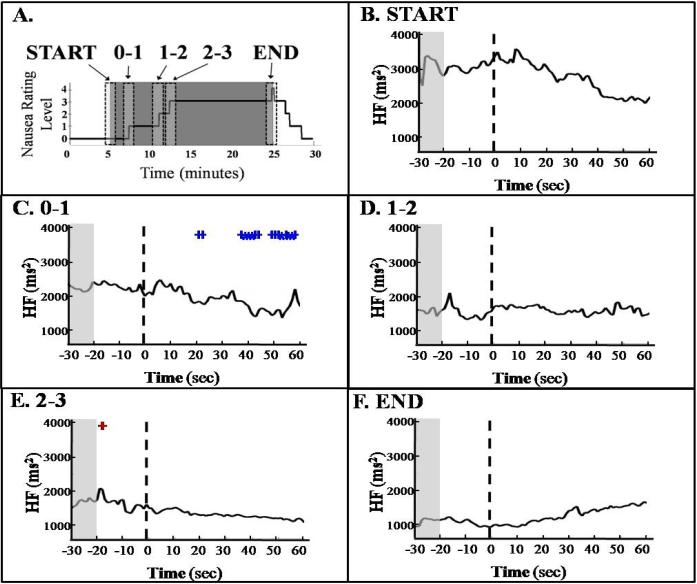
Figure 2.
HF Averaged Across Subjects. Each second of HF 20 s before an event to 60 s after an event was compared to the mean of the region between 30 s and 20 s before an event (paired t-test). Events included beginning (“START”) and end (“END”) of the stimulus as well as rating increases to “1” (“0-1”), “2” (“1-2”), and “3” (“2-3”). (+: 0.1 ≥ p > 0.05; *: p ≤ 0.05)

