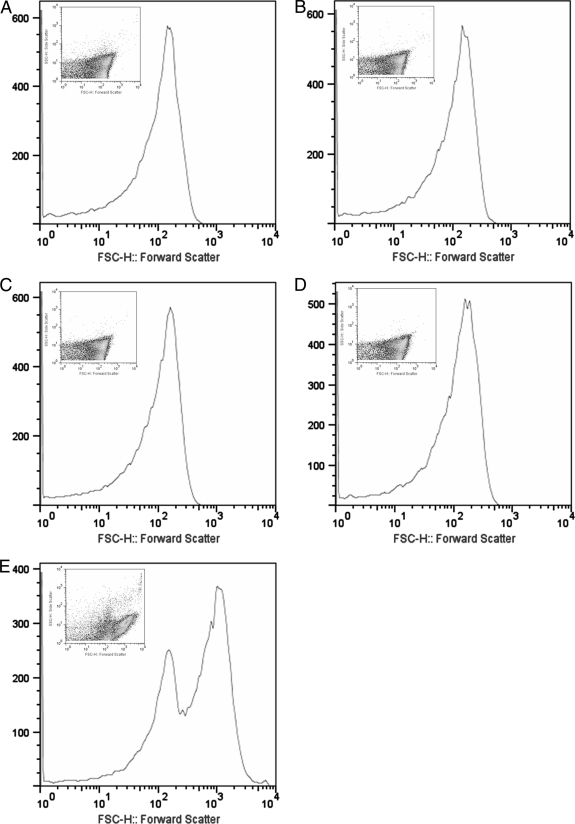
FIG. 4.
A7 mediates aggregation of ST3. Flow cytometric analysis was performed on mixtures of MAbs and Oregon Green-labeled ST3 (ATCC 6303). Cell size and forward scatter were determined for ST3 alone (A), 10 μg 57E2 (human MAb to PPS8) (B), 1 μg 57E2 (C), 1 μg A7 (D), and 10 μg A7 (E). Insets depict scatter plot analyses of cellular size.

