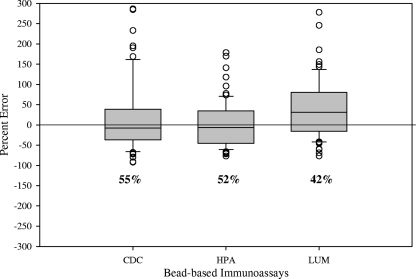
FIG. 1.
Comparison of IgG concentrations using the percent error from the mean to calculate agreement between bead-based immunoassays and WHO reference assignments for PCV-7 serotypes. Box plots give the mean concentration and the 25% and 75% quartiles. Concentrations outside of the 95% confidence intervals are represented by open circles. Percentages below the box plots are the levels of agreement.

