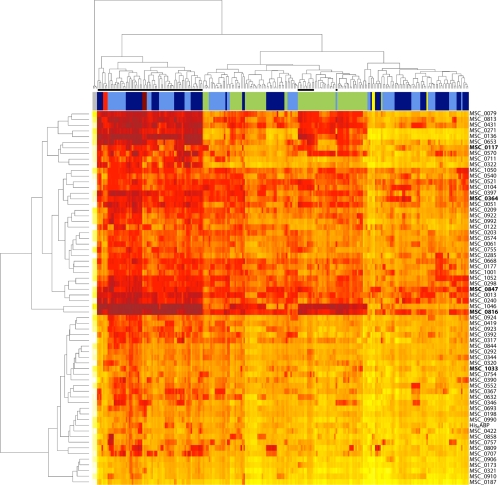
FIG. 2.
Cluster analysis of the complete data set. A heat map displaying hierarchical cluster analysis of Euclidean distances of log2-transformed signals was used to visualize the whole data set. The serum sample dendrogram on top forms major clusters of (i) samples taken during clinical CBPP (denoted by black bars), (ii) all samples but one from T1/44-vaccinated cattle (green bars) and samples from recombinant protein immunized cattle (dark blue bars) and controls (light blue bars) taken prior to onset of CBPP, and finally (iii) samples taken early in the trial. The protein dendrogram on the left forms two clusters of immunogenic proteins and proteins demonstrating low signals (native counterpart of recombinant protein displayed to the right). Among the immunogenic proteins, recombinants corresponding to MSC_1046 (LppQ) and MSC_0816 form a subcluster with the high titers in clinical CBPP samples and T1/44-vaccinated cattle. The five components of the recombinant protein vaccine candidate are marked in bold. Replicates of two positive control sera (red and dark red) and serum-free blanks (gray) cluster as expected. Replicates of the negative control serum (yellow) are found in the cluster of low-signal sera. Color intensity denotes signal intensity: white is low, orange is medium, and red is high.

