Fig. 5.
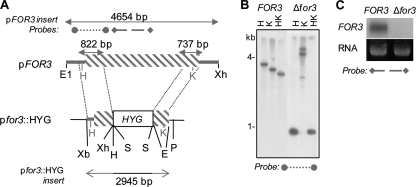
Disruption of the FOR3 gene in F. oxysporum f. sp. nicotianae. (A) Schematic view of the FOR3 gene disruption strategy. The DNA inserts of pFOR3 and pfor3::HYG are shown. The FOR3 coding region is indicated by the gray striped box and noncoding regions by the gray line. The vector sequences are indicated by the black line. Restriction sites on the cloning vector are indicated in black, and those in FOR3 are indicated in gray. The sizes of cloned DNA fragments (double-headed arrows), as well as the probes used for Southern (dotted line) or Northern (dashed line) blot analyses, are indicated. Restriction site abbreviations are as follows: E, EcoRV; E1, EcoRI; H, HindIII; K, KpnI; P, PstI; S, SalI; Xb, XbaI; Xh, XhoI. (B) Southern blot of restriction-digested genomic DNA of the wild-type (FOR3) and Δfor3 mutant strains. Restriction site abbreviations are as in panel A. (C) Northern blot of total RNA of the wild-type (FOR3) and Δfor3 mutant strains with a FOR3 probe (FOR3) and the corresponding ethidium bromide signal (RNA) shown.

