Fig. 1.
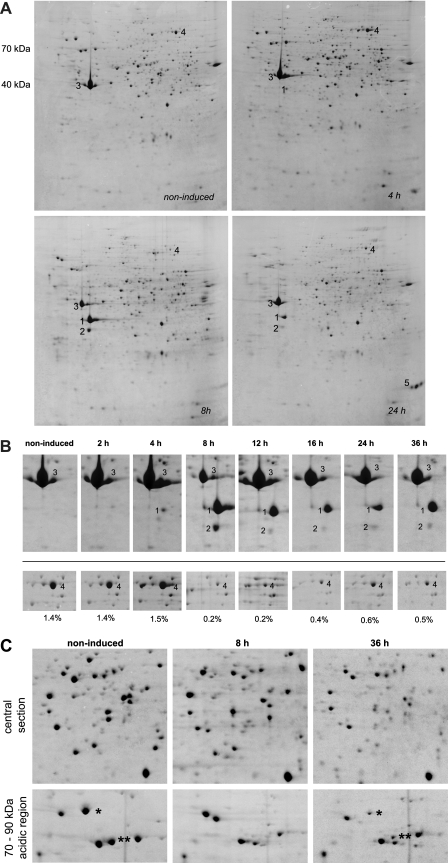
Course of encystment in A. castellanii PAT06. (A) The cells were induced to encyst in starvation medium and harvested at the time points given. Subsequently, samples were prepared for 2DE. Spot 1, actin isoform; spot 2, another actin isoform; spot 3, actin; spot 4, translation elongation factor 2 (EF2); spot 5, unidentified encystment specific protein. The 2D gels (12.5% polyacrylamide) have a pI range of 3 (left) to 10 (right). The molecular masses are indicated next to the top left gel. (B) Sections from 2DE gels, including more time points. The numbers refer to the same spots or proteins as in panel A. The proportion of EF2 of the total protein visualized on the 2D gels is given below the respective images. (C) Two sections from 2D gels corresponding to noninduced cells and cells 8 h and 36 h after induction of encystment. In the 70- to 90-kDa region in the acidic part of the gel, several trophozoite proteins are marked by asterisks; these proteins disappear 8 h after induction and reappear later in encystment.

