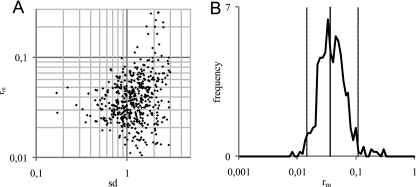
FIG. 2.
Estimating variability in spiking levels between repetitions (sd) and recovery (rm) for Salmonella in wheat grain by Monte Carlo simulation. (A) Distribution of sd and rm from 643 out of 50,000 simulated experiments. Each dot represents a hit, that is, an experiment that resembled the results from the experimental study. (B) Frequency distribution for rm that is used as approximation of posterior distribution of rm in wheat grain. The vertical lines are 2.5th, 50th, and 97.5th percentiles, respectively.

