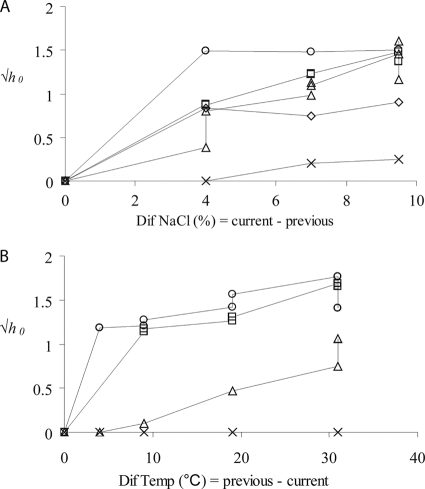
FIG. 1.
Effect of the previous and current environments on the amount of work to be done during the lag phase. h0 depended on the magnitude of the sudden change in the aw or temperature and also on the final temperature and aw values. (A) Effect of an increase in the level of NaCl on h0 at 6°C (○), 10°C (□), 15°C (▵), 28(⋄), and 37°C (×). The final level of NaCl was 10%. (B) Effect of a decrease in temperature on h0 with 10% (○), 6% (□), 3% (▵), and 0.5% (×) NaCl. The final temperature was 6°C.

