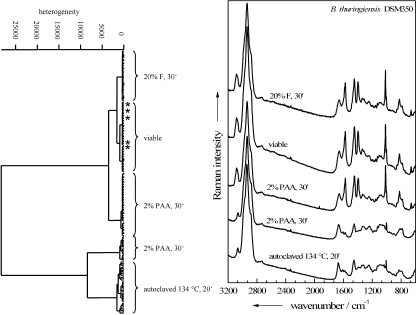
FIG. 6.
Dendrogram obtained from a hierarchical cluster analysis performed on Raman spectra of differently treated single endospores of B. thuringiensis DSM 350. Shown are the Raman spectra (right) and dendrogram (left) for viable, untreated cells and for endospores inactivated either by 20% formaldehyde for 30 min (20% F, 30′), by 2% peracetic acid for 30 min (2% PAA, 30′), or by autoclaving at 134°C for 20 min (134°C, 20′). Asterisks mark wrongly classified spectra.

