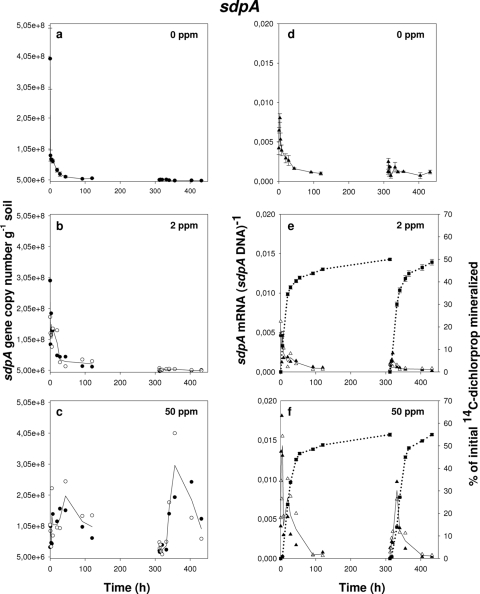
FIG. 4.
Progress curves of sdpA gene copy numbers (a to c), sdpA transcription activity represented as ratios of sdpA mRNA to sdpA DNA (d to f), and (R,S)-[14C]dichlorprop mineralization (e and f) during exposure of Delftia acidovorans MC1 to different concentrations of (R,S)-dichlorprop in soil: 0 mg kg−1 (a and d), 2 mg kg−1 (b and e), and 50 mg kg−1 (c and f). Amendment with (R,S)-dichlorprop was done at 0 h followed by a second amendment at 312 h. Data from microcosms not amended with (R,S)-dichlorprop (a and d) are shown from triplicate soil microcosms with error bars representing standard errors of the means. In panels b, c, e, and f, open and filled symbols each represent the data set from one individual soil microcosm while the lines running through the data points represent the means of the two replicates. Symbols: ○ and •, sdpA DNA; ▵ and ▴, ratio of sdpA mRNA to sdpA DNA; ▪, mineralization of (R,S)-dichlorprop.

