
FIG. 4.
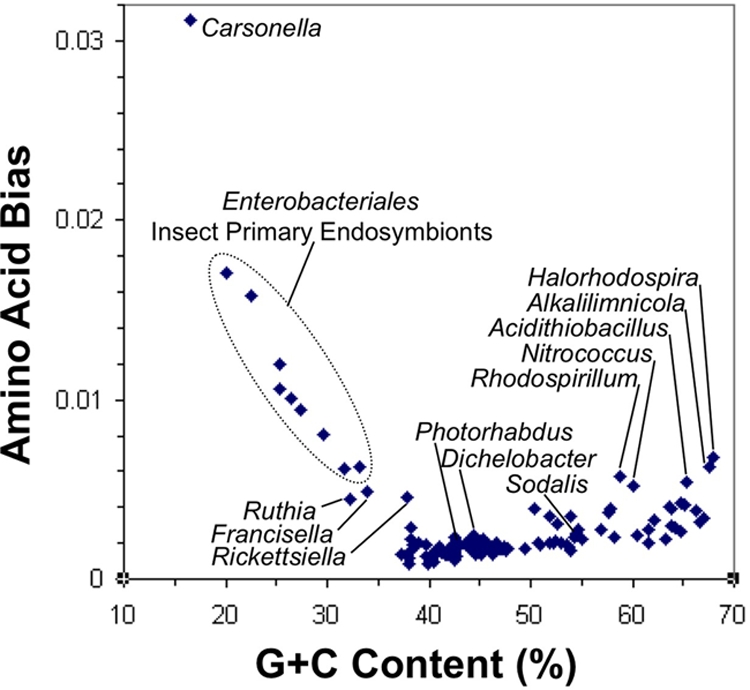
Compositional bias. Amino acid bias was measured according to the method of Karlin (15) for the set of 61 all-taxon protein families that contain Ca. Carsonella and plotted against nucleotide composition, producing a horn of A+T-rich endosymbionts with Ca. Carsonella at its tip.