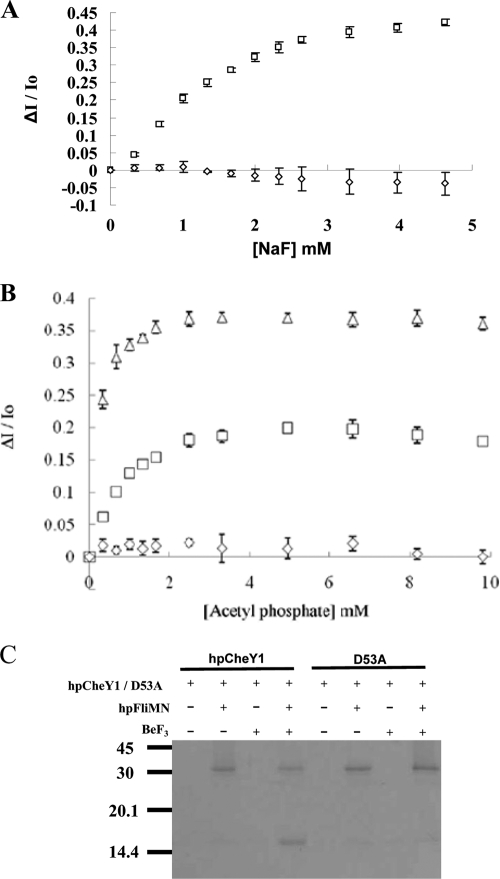
FIG. 2.
Activation of HpCheY1 by beryllofluoride. Fluorescence spectroscopy analysis of HpCheY1 (□), HpCheY1/D53A (⋄), and HpCheY1/T84A (▵) upon addition of sodium fluoride (A) and acetyl phosphate (B) is plotted. Fluorescence changes were plotted as ΔI/Io against concentration, where ΔI represents the cumulative changes in fluorescence intensity at the corresponding small molecule concentrations and Io is fluorescence intensity without addition of small molecules. (C) Pull-down study of HpCheY1 with HpFliM. Purified HpFliMNM in 0.1 mg/ml was immobilized on prewashed resin. HpCheY1 or the D53A mutant in a 2:1 molar ratio to HpFliMNM was incubated with immobilized HpFliMNM with or without BeF3− at 25°C for 15 min.

