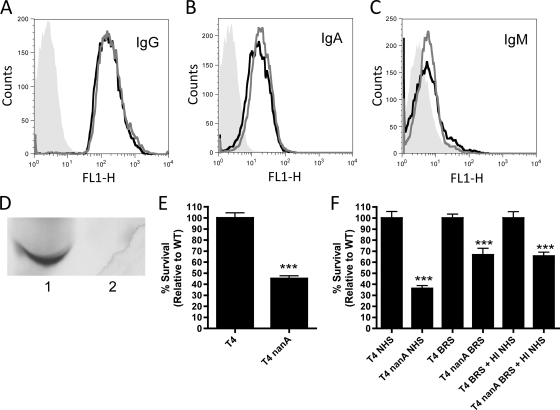
FIG. 5.
Contribution of antibodies on the effect of NanA in NHS. (A to C) Levels of IgG (A), IgA (B), and IgM (C) in NHS were assessed by antibody binding assays on both T4 (black lines) and T4 nanA (gray lines) cells relative to unopsonized cells (gray fill). (D) Western blot detecting IgG heavy chain presence in NHS (1) and IgG-depleted NHS (2). (E) IgG-depleted serum was used to opsonize bacteria in opsonophagocytic killing assays. (F) Opsonophagocytic killing assays where bacteria were opsonized in either 10% NHS, 66% BRS, or a mixture of 10% BRS and 10% HI NHS (as a source of antibodies) to determine the role of antibodies in mediating the difference in phenotype observed in NHS versus BRS. Data are the means from at least two independent experiments performed in duplicate ± SEM. ***, P < 0.001 compared to WT.

