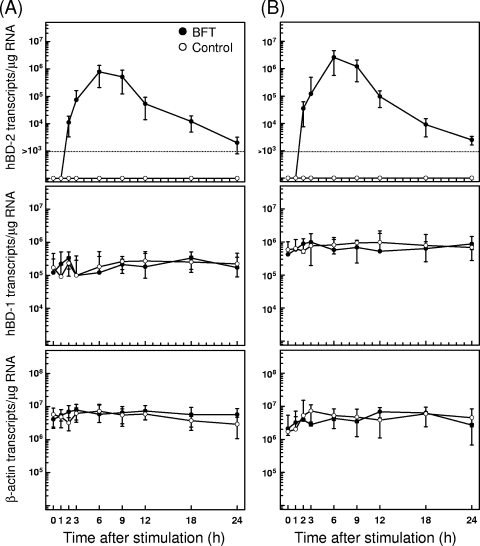
FIG. 1.
Time course of hBD mRNA expression in HT-29 and Caco-2 cells after treatment with BFT. HT-29 (A) and Caco-2 cells (B) were treated with BFT (300 ng/ml) for the indicated periods. Levels of hBD-1, hBD-2, and β-actin mRNA were analyzed by quantitative RT-PCR using each standard RNA. The values are expressed as means ± SD of five different experiments.

