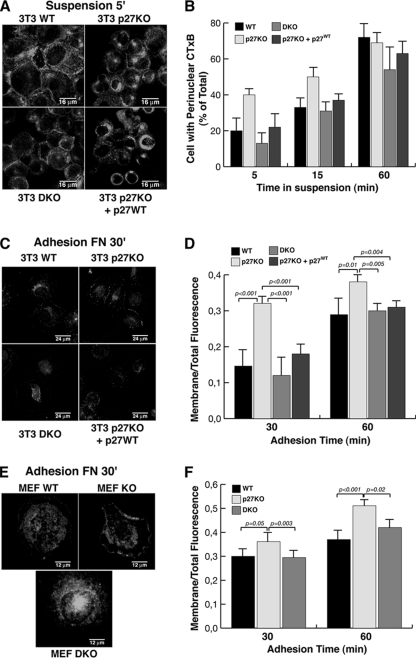
FIG. 5.
p27 KO fibroblasts display altered vesicular trafficking. (A) Confocal microscopy of WT, p27 KO, DKO, and p27 KO 3T3 fibroblasts stably reexpressing p27 and labeled with CTxB (green) to visualize lipid rafts. Cells were labeled for 15 min at 4°C and then detached and kept in suspension for 5 min to allow the internalization of labeled lipid rafts. White arrowheads indicate cells with perinuclear accumulation of labeled lipid rafts. Typical images of cytospun cells are shown. (B) Graphical presentation of the results from the experiments shown in panel A, based on the number cells positive for perinuclear accumulation of labeled lipid rafts at the indicated times of suspension, expressed as a percentage of total counted cells. The results represent the means of two different experiments, in which at least 100 cells for each cell population and for each time point were counted. (C) The same experiment as in panel A, except cells were kept in suspension for 60 min to allow complete internalization of labeled lipid rafts (CTxB; red) and then adhered to FN-coated coverslips for 30 min to monitor lipid raft relocalization to the plasma membrane. Nuclei were counterstained with Sytox Green (green). (D) Graphical presentation of the ratios between the fluorescence present at the membrane level and the total fluorescence of the cell, from the experiments described for panel C. The results represent the means of two different experiments in which at least 20 cells for each cell population and for each time point were analyzed using the Leica LAS software. (E) Same experiment as in panel C, except that primary MEFs were used. (F) Graphical presentation of the ratios between the fluorescence present at the membrane level and the total fluorescence of the cell, from experiments described for panel E. The results represent the means of two different experiments, in which at least 20 cells for each cell population and for each time point were analyzed using the Leica LAS software.

