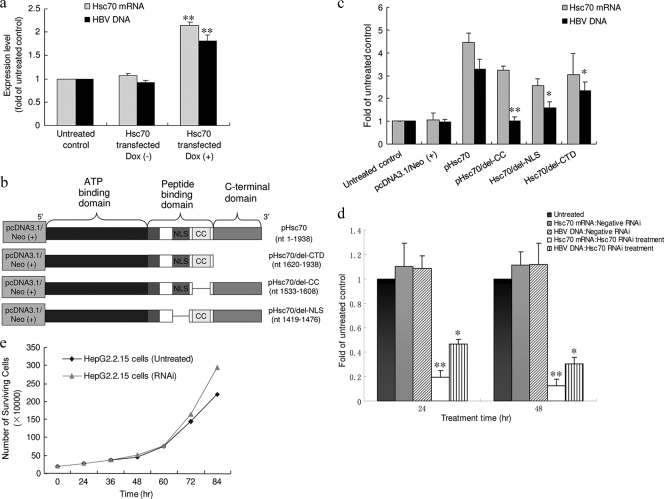
FIG. 1.
Host Hsc70 expression regulates HBV DNA replication. (a) HepG2.2.15 cells were cotransfected with the two vectors mentioned in Materials and Methods; 24 h later, Dox (1 μg/ml) was add to the culture media. The amounts of Hsc70 mRNA and HBV DNA in the untreated HepG2.2.15 cells was defined as 1, and the amounts of Hsc70 or HBV DNA in the cells with [Dox (+)] or without [Dox (−)] Dox were plotted relative to that value. *, P < 0.001 relative to Dox (−). The experiment was performed 4 times. Shown are means and SD. (b) Diagram of the wild type and deletion mutants of the Hsc70 gene, which were used for the construction of pHsc70, pHsc70/del-CTD, pHsc70/del-CC, and pHsc70/del-NLS with pcDNA3.1/Neo (+). (c) HepG2.2.15 cells were transfected with pHsc70, pHsc70/del-NLS, pHsc70/del-CC, or pHsc70/del-CTD for 48 h. The mRNA expression of Hsc70, Hsc70/del-NLS, Hsc70/del-CC, and Hsc70/del-CTD was analyzed by real-time RT-PCR, with parallel measurement of HBV DNA. The experiment was performed 3 times. Shown are means and SD. *, P < 0.01, and **, P < 0.001 versus the pHsc70 group. (d) HepG2.2.15 cells were transfected with Hsc70 siRNA (816 to 840 bp) or negative RNAi (reference control) for 24 or 48 h, respectively. Total cellular RNA, as well as intracellular DNA, was isolated to measure Hsc70 mRNA and HBV DNA. The amount of Hsc70 mRNA or HBV DNA in the treated cells was normalized to that of the untreated control. The experiment was performed more than 6 times. Shown are means and SD. *, P < 0.01, and **, P < 0.001 versus untreated controls. (e) Growth curves for HepG2.2.15 cells with or without Hsc70 RNAi. The numbers of surviving cells were plotted against the time of treatment.

