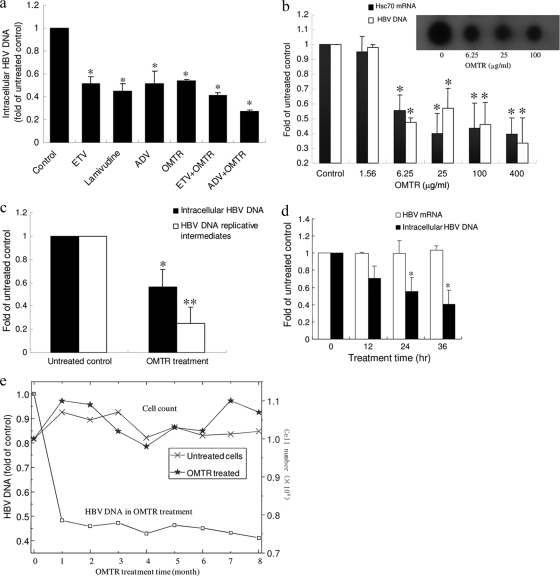
FIG. 3.
Anti-HBV activity of OMTR in vitro. (a) OMTR was used to treat HepG2.2.15 cells alone or in combination with known anti-HBV drugs. The treatment was continued for 72 h, followed by HBV DNA measurement. ETV, entecavir (0.6 μg/ml; 2.16 μM); ADV, adefovir (3 μg/ml; 5.9 μM); lamivudine (3 μg/ml; 13 μM); OMTR (30 μg/ml; 113 μM). The experiment was repeated twice. Shown are means and SD. *, P < 0.01 versus untreated control. (b) HepG2.2.15 cells were treated with OMTR at the indicated concentrations, which were equal to 5.9, 23.6, 94.5, and 378 μM and 1.51 mM. After 72 h of incubation, Hsc70 mRNA and HBV DNA were examined. The amounts of Hsc70 mRNA and HBV DNA in the untreated cells were defined as 1, and the amounts in the cells treated with OMTR were plotted relative to those values. (Inset) Dot blot detection of the HBV DNA. Shown are means and SD. *, P < 0.01 versus untreated control. (c) The anti-HBV effect of OMTR on HBV de novo synthesis was examined in HepG2.2.15 cells. After 24 h of treatment with OMTR (0.4 mg/ml; 1.51 mM), cellular genomic DNA, as well as HBV DNA replicative intermediates, was isolated and measured by real-time PCR. The experiment was performed 3 times. Shown are means and SD. *, P < 0.01, and **, P < 0.001 versus untreated control. (d) HepG2.2.15 cells were treated with OMTR (0.4 mg/ml; 1.51 mM) for 12, 24, or 36 h, followed by measurement of the HBV DNA and HBV mRNA. The amount of DNA or RNA extracted from the treated cells was standardized to the mean level of the untreated cells, defined as 1.0. The experiment was performed 3 times. Shown are means and SD. *, P < 0.01 versus untreated control. (e) HepG2.2.15 cells were continuously exposed to a suboptimal dose of OMTR (30 μg/ml; 113 μM) for 8 months. The HBV DNA level and cell count were determined every 30 days. The HBV DNA in the untreated flasks at each time point was defined as 1, and the amount of HBV DNA of the treated cells at that time point was plotted relative to that value. The result for each time point represents an average of 2 flasks.

