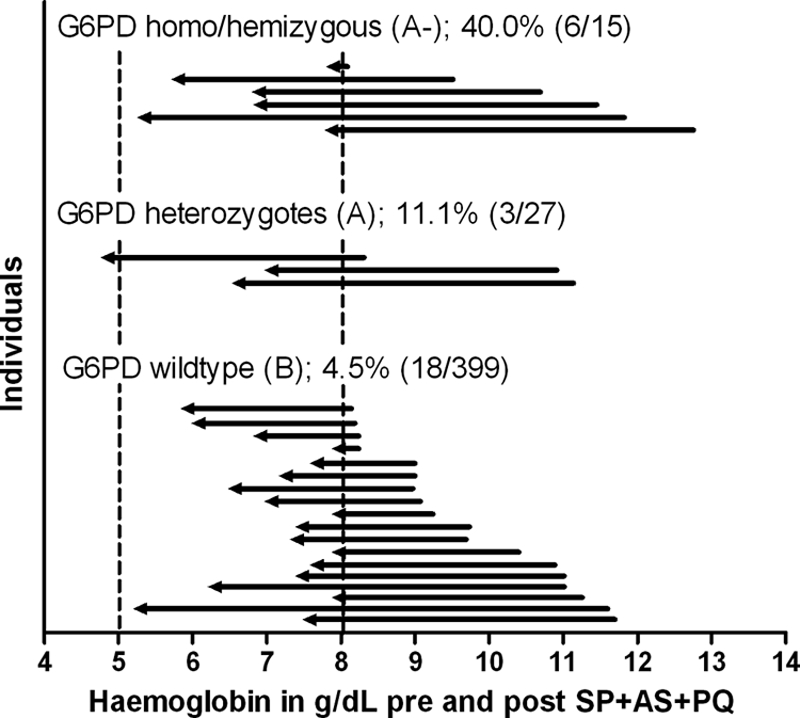
FIG. 2.

Hb concentrations before and after SP+AS+PQ treatment for those individuals who became moderately anemic (Hb level of <8 g/dl) after the intervention. On the x axis is the hemoglobin concentration in g/dl; on the y axis are individual observations for G6PD homo-/hemizygous individuals (6 of 15 individuals treated [40%] became moderately anemic), heterozygotes (3 of 27 individuals [11.1%]), and wild-type individuals (18 of 399 individuals [4.5%]). Arrows represent individual baseline (right) and postintervention (left) hemoglobin measurements. Dashed lines represent the values below which individuals are considered to have severe (5 g/dl) or moderate (8 g/dl) anemia.
