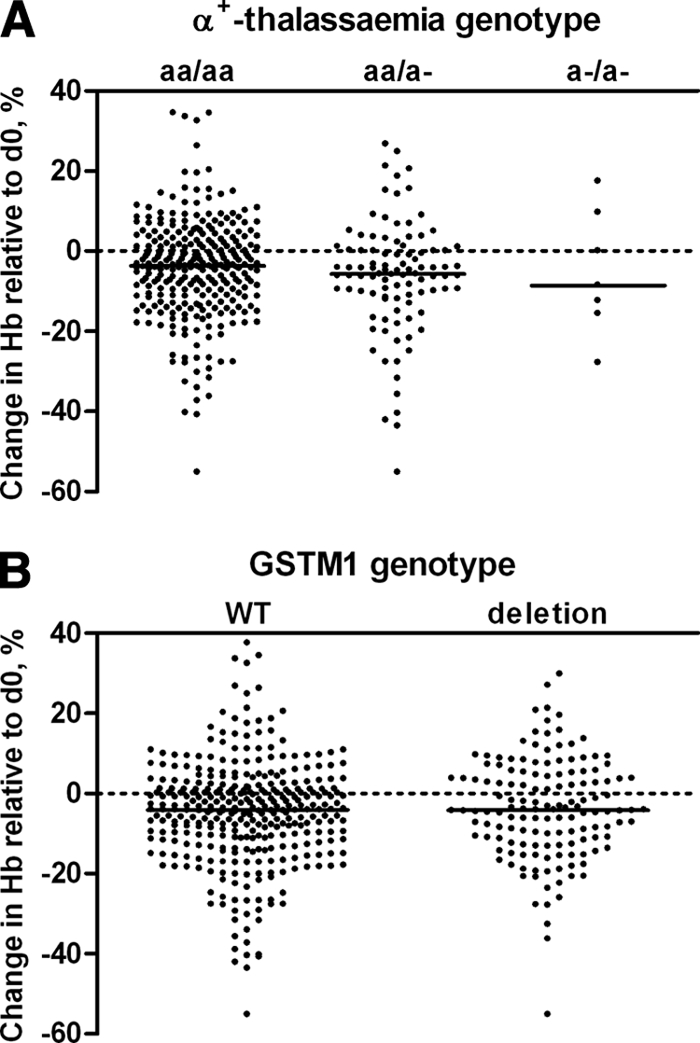
FIG. 3.

Hb concentration on day 7 after treatment with SP+AS+PQ, shown as a percentage of the baseline value in relation to α+-thalassemia genotype (A) or GSTM1 genotype (B). The reduction in Hb concentration was not related to α+-thalassemia genotype (P = 0.23) or GSTM1 genotype (P = 0.50).
