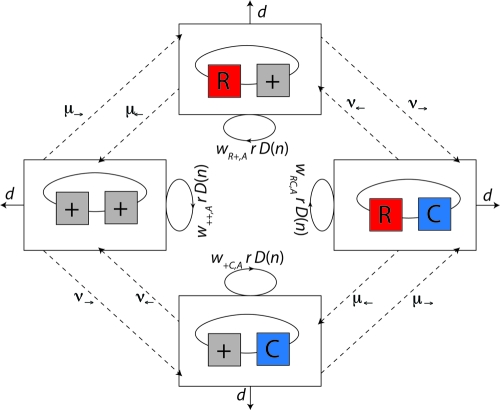
FIG. 1.
Diagram of model 1. We consider two loci, a resistance and a compensation locus, resulting in four possible genotypes: wild type (++), resistance mutation only (R+), compensatory mutation only (+C), and resistant-compensated genotype (RC). Each genotype is represented by a box. Strains of all genotypes die with a rate d (see solid lines leaving the boxes) and replicate depending on their individual fitness levels in the current environment, wij,A, and a density-dependent term, D(n), which corresponds to 1 minus the total population size divided by the carrying capacity  (see circular arrows). Mutations occur at rates μ→ and μ← at the resistance locus and at rates ν→ and ν← at the compensatory locus (see dotted lines between the boxes). In this notation, the subscript arrows denote the direction of mutation.

