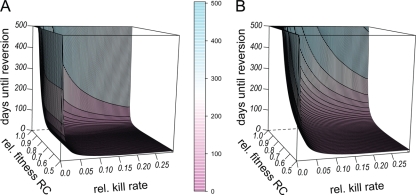
FIG. 8.
Reversion to susceptibility after cessation of treatment and relative to kill rate. In this figure, we show how the fitness of the RC genotype and the bacterial kill rate relative to the growth rate influence reversion to susceptibility. The initial population consisted of 109 bacteria of the R+ (A) or the RC (B) genotype. The x axis (horizontal) shows the relative kill rate, i.e., the kill rate divided by the growth rate, and the y axis shows the efficiency of compensation, and thus RC fitness relative to that of the wild type. On the z axis are the numbers of days until >95% of the population consisted of the wild-type genotype. Other parameters take the following values: a = 1, eR = 1, cR = 0.5, cC = 0.5, eR = 1, μ→ = 10−8, and N0 = 109.

